Inventory Management Dashboard
Monitor stock levels, warehouse performance and reorder alerts in real time.
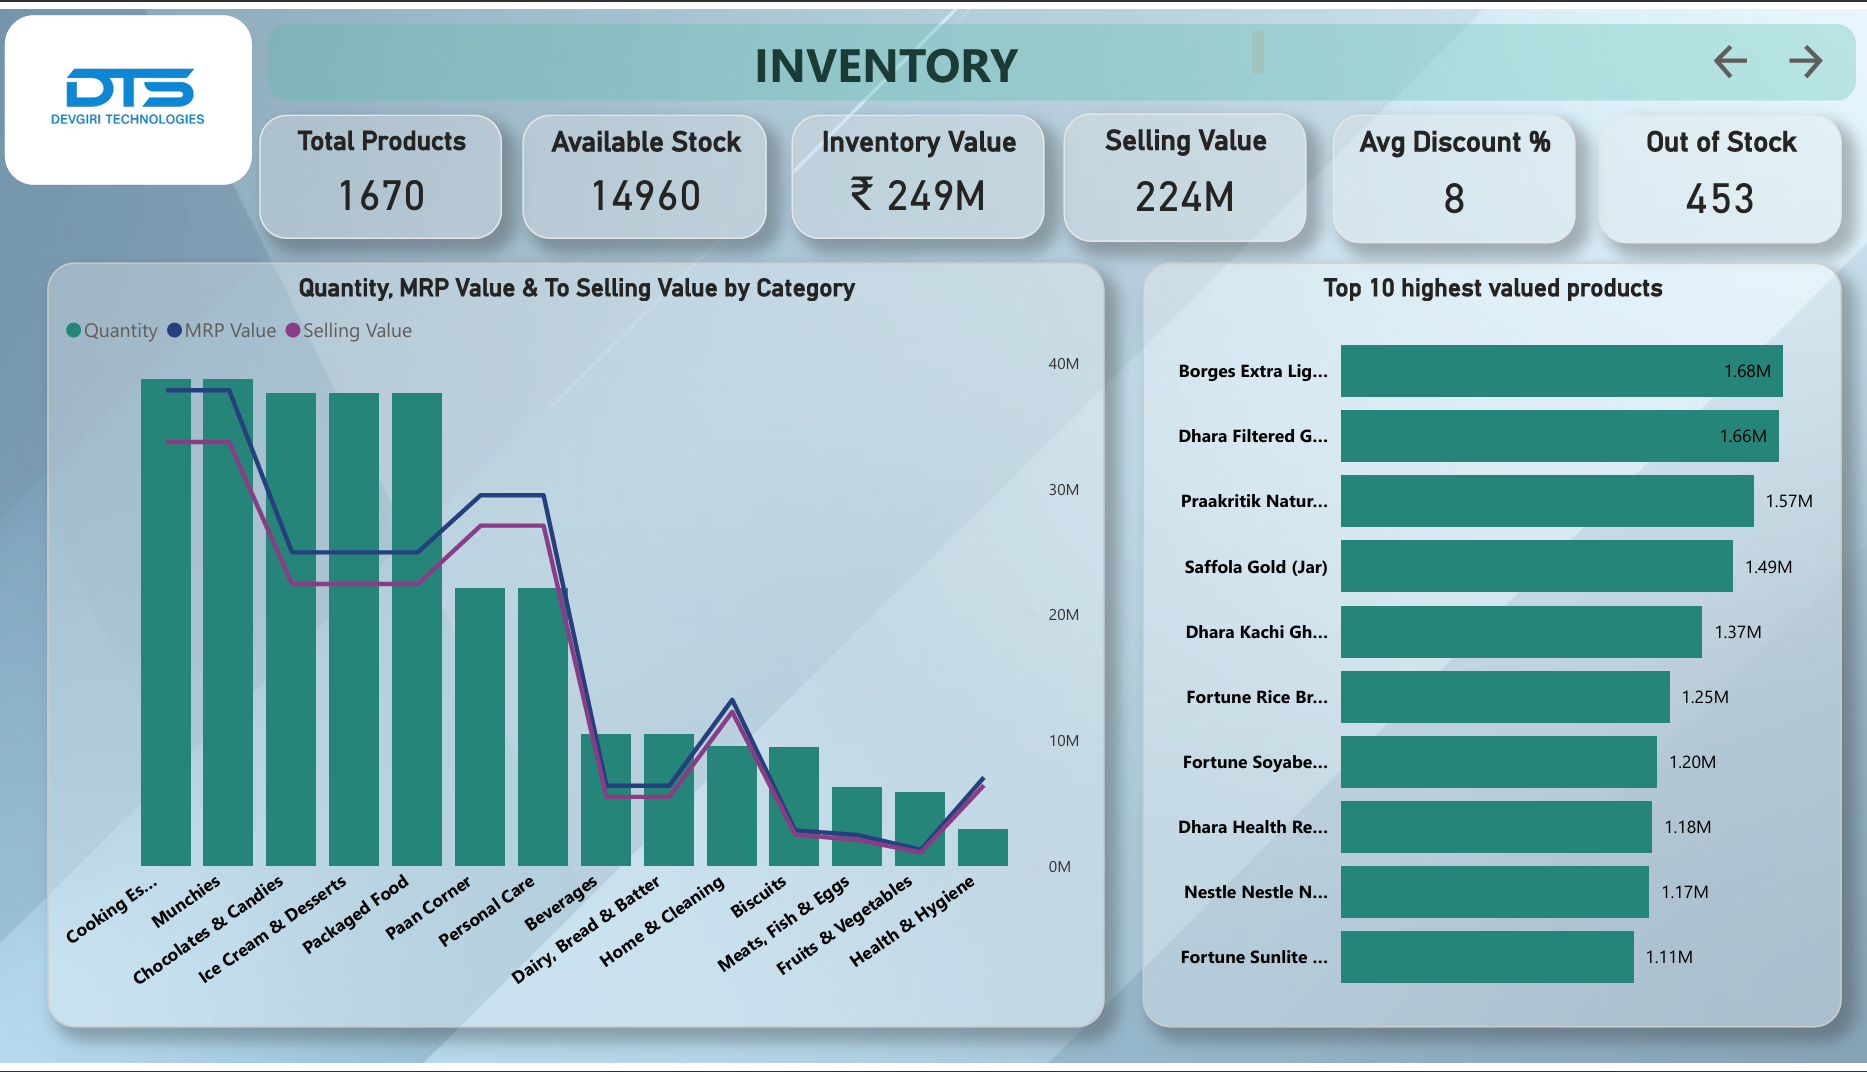
Key Inventory Metrics
Stock Availability
Percent of SKUs currently in stock.
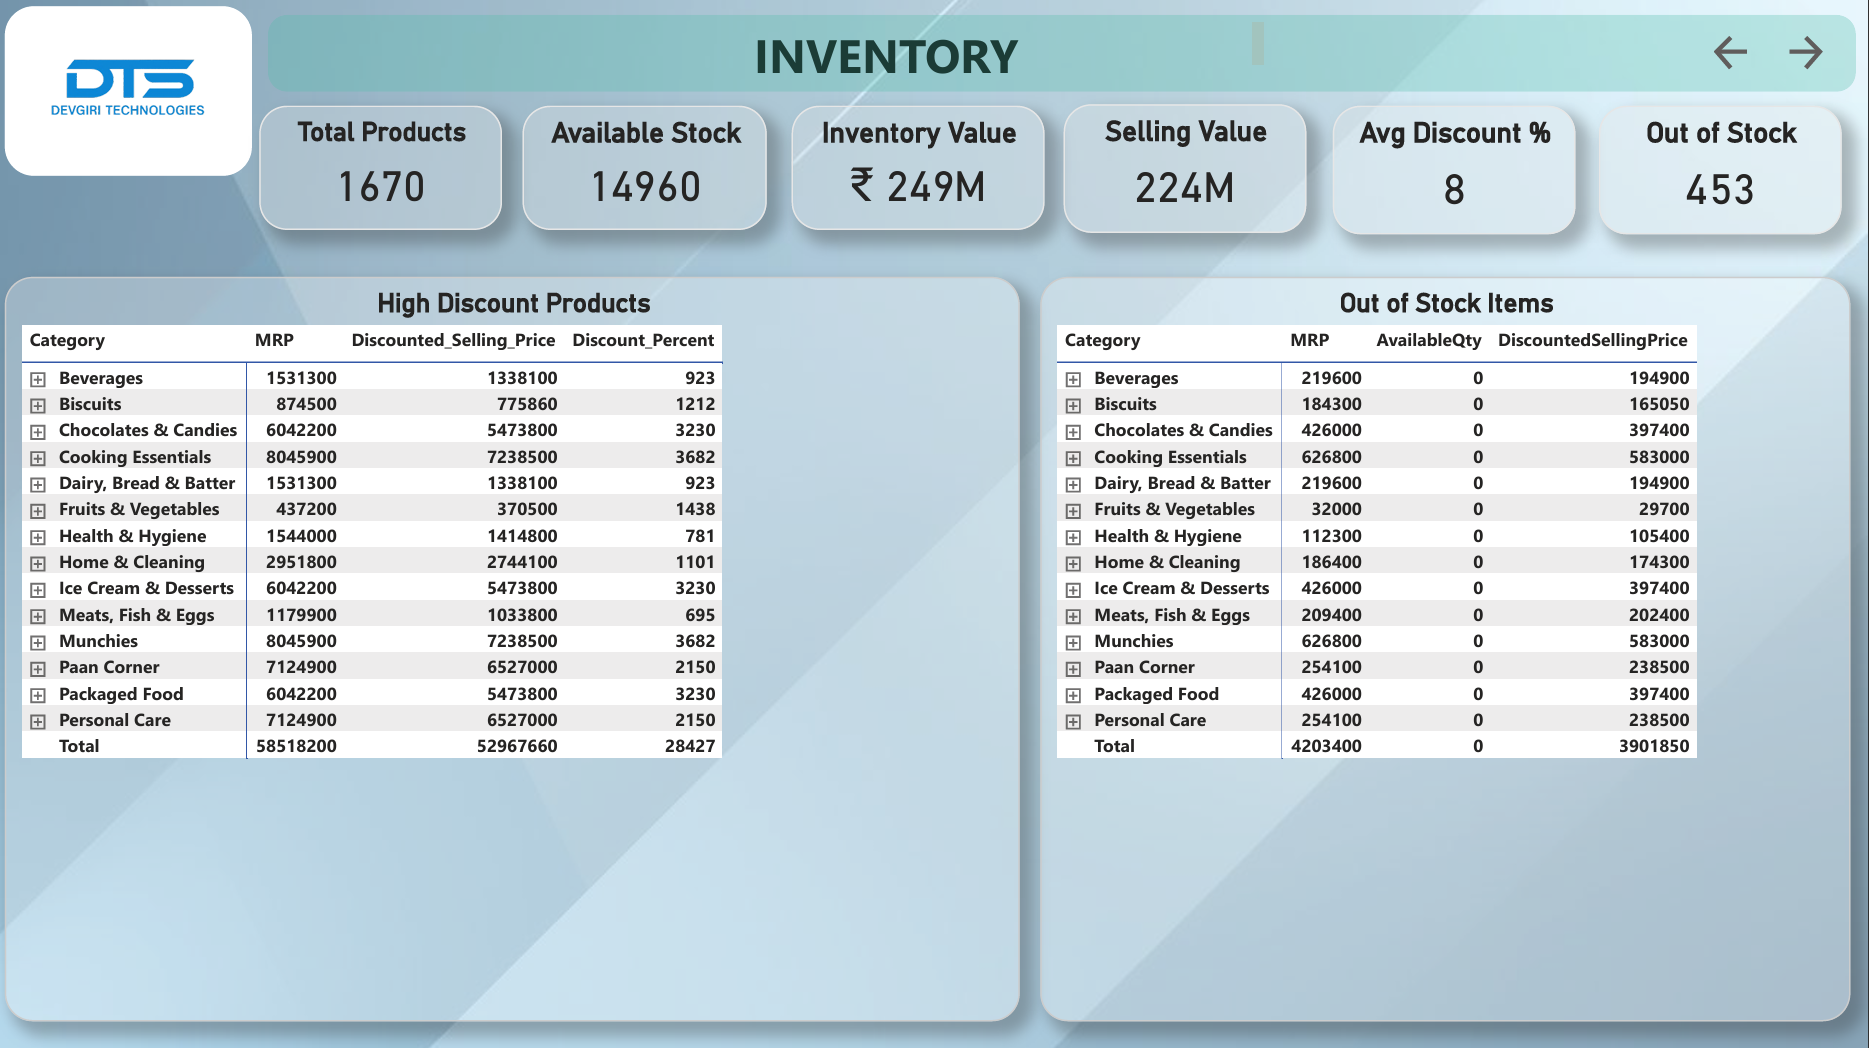
Reorder Alerts
Items below reorder level.
Turnover Rate
How often inventory cycles per period.
Warehouse Utilization
Space & throughput metrics.
Importance of Inventory Analytics
- Prevent stockouts and overstocks.
- Optimize reorder points and safety stock.
- Improve warehouse efficiency and picking accuracy.
- Reduce carrying costs and free working capital.
- Alerts when items are running low, ensuring timely reordering and preventing service interruptions.
- Low-stock alerts, expiry notifications, and reorder recommendations ensure timely action.
Inventory FAQ
Inventory turnover measures how many times inventory is sold and replaced over a period.
Yes. Reports can typically be exported in formats such as PDF, Excel, or CSV for further analysis or sharing with stakeholders.
Yes — Power BI and embedded reports can aggregate multiple warehouse sources into one view.
Approximately, it takes about 5 to 10 days. But it also depends on the data of organization mainly.